
Authored by Pandelis Mouratoglou, Matin Mahmood and Savva Lambin.
The Alignment Navigation Problem
When we first entered the field of AI alignment, we found it incredibly challenging to get a bird's-eye view of the research landscape. Research papers and posts are scattered across scientific databases, platforms like LessWrong, the Alignment Forum, and various YouTube channels, creating a fragmented knowledge space that's difficult to navigate.
Even seasoned researchers face what we’ve come to call “the alignment navigation problem” – with over 45,000 papers published since 2018 (including 14,500 in 2023 alone) the field's exponential growth has created an increasingly complex web of ideas without a coordinated system to map their relationships.
As AI systems grow more powerful, we need more researchers to quickly orient themselves. This challenge inspired us to create an open-source tool that clusters 5000+ AI Alignment research papers using a LLM and visualizes them in an interactive, network-style knowledge graph (similar to Obsidian[1]) where documents are connected by semantic relationships and can be explored through clickable nodes and links. The project started at an Apart hackathon with the aim to assist both newcomers and experienced researchers navigate the AI alignment landscape more effectively.
Explore the Live Visualization →
Our Approach: LLM Clustering
Traditional clustering methods often rely on embeddings or citation networks, which can miss subtle conceptual relationships between papers. We decided to leverage an LLM (specifically, Claude 3.5 from Anthropic) to cluster research papers into coherent topics and subtopics based on their abstracts.
Here's a snippet (Figure 1) of the prompt we used to make Claude act as a “conceptual cartographer”:
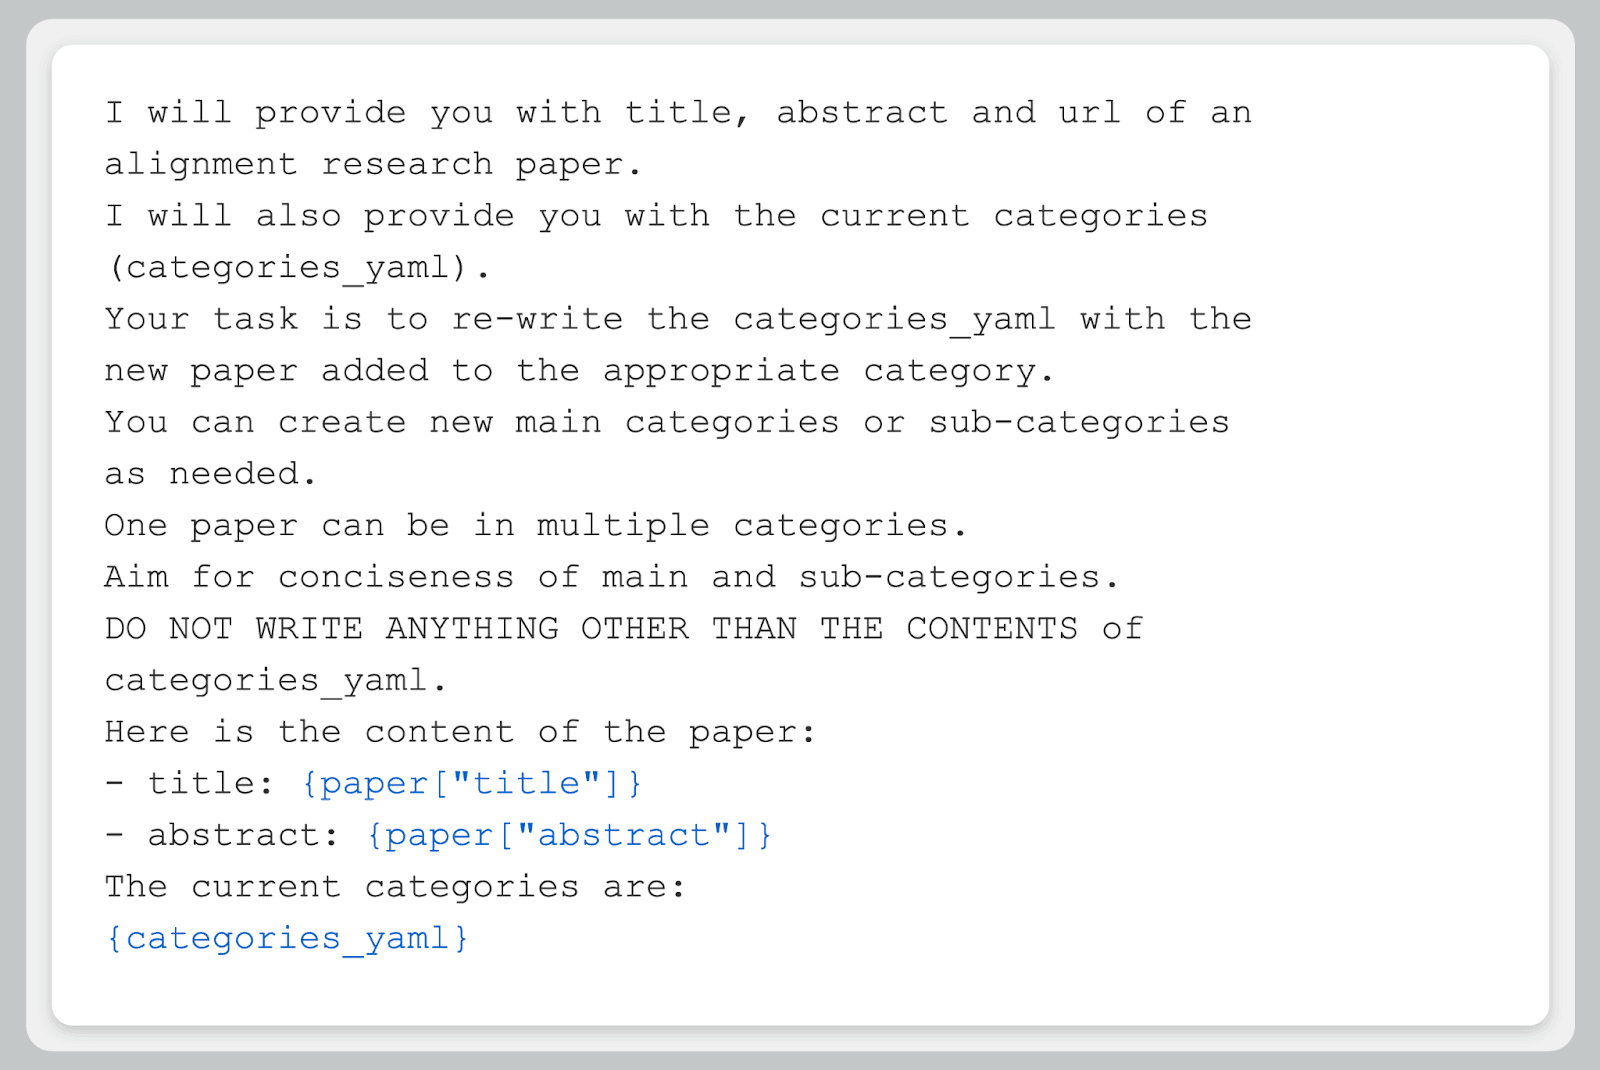
Figure 1: LLM prompt used for conceptual mapping during clustering
Our LLM-based approach offers more nuanced and meaningful groupings than traditional methods by understanding the semantic relationships between papers beyond simple keyword matching or citation patterns - it can identify thematic connections, methodological similarities, and conceptual links that might not be apparent through statistical clustering alone (Chen et al., 2022). The clusters come with intuitive labels right out of the box, making it easier to navigate complex topics.
Making Connections Visible
We've transformed these LLM-generated clusters into an interactive visualization. Each node represents a research area [2], and edges show their relationships. You can click a node to explore subtopics or zoom out for a broader view; see Figure 2.
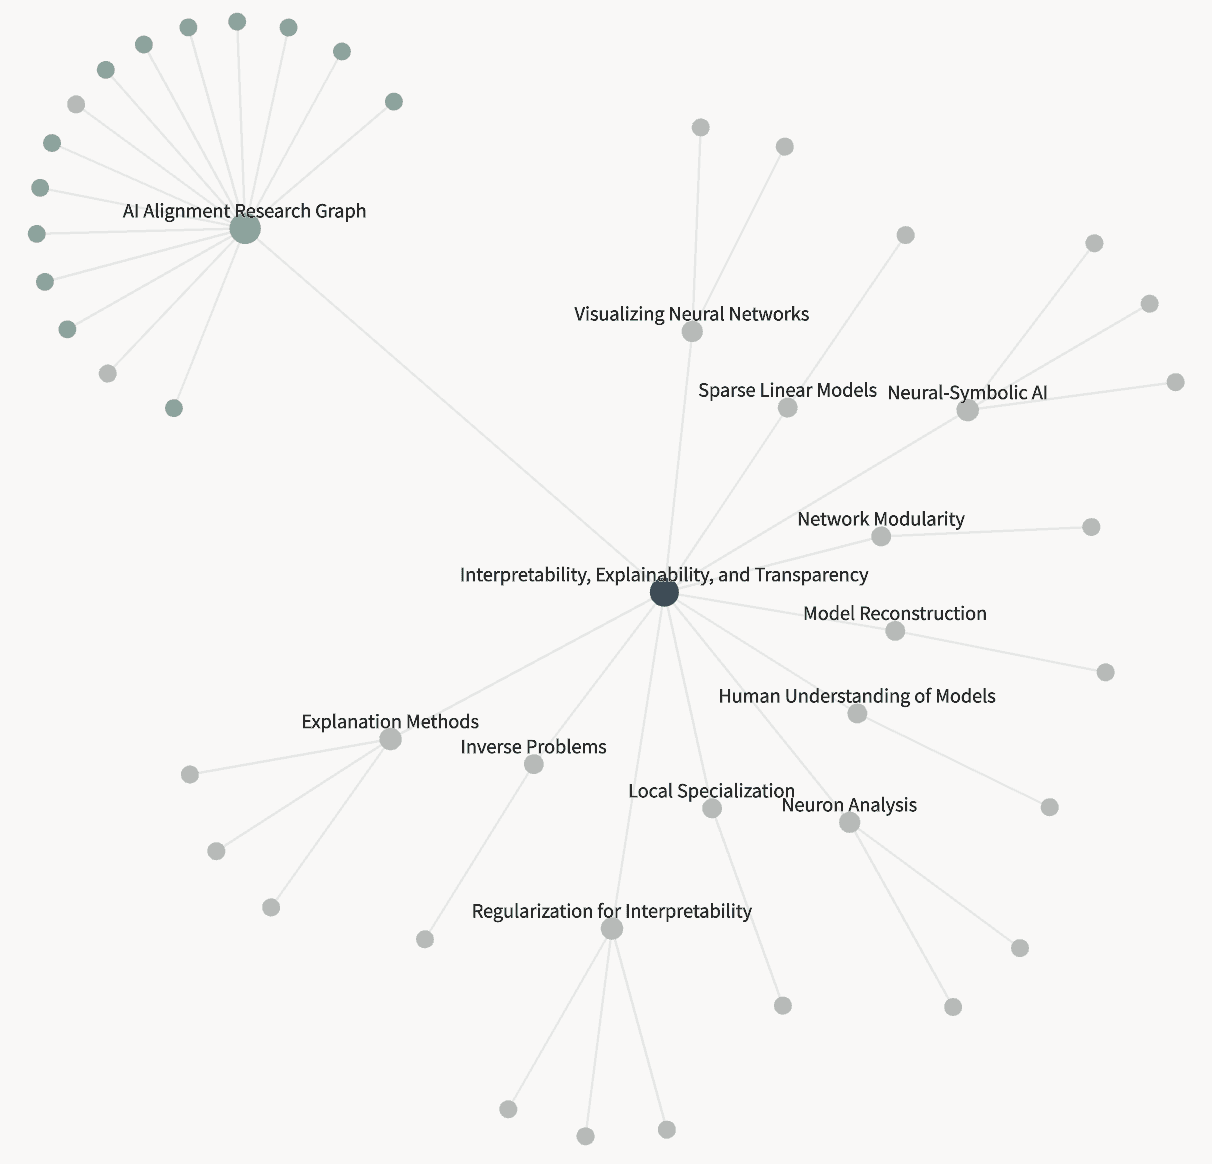
Figure 2: Graph representation snippet showing relationships between topics and subtopics
We've also generated summaries for each subtopic during LLM clustering. These concise overviews distill essential insights from multiple papers, helping you grasp complex ideas quickly.
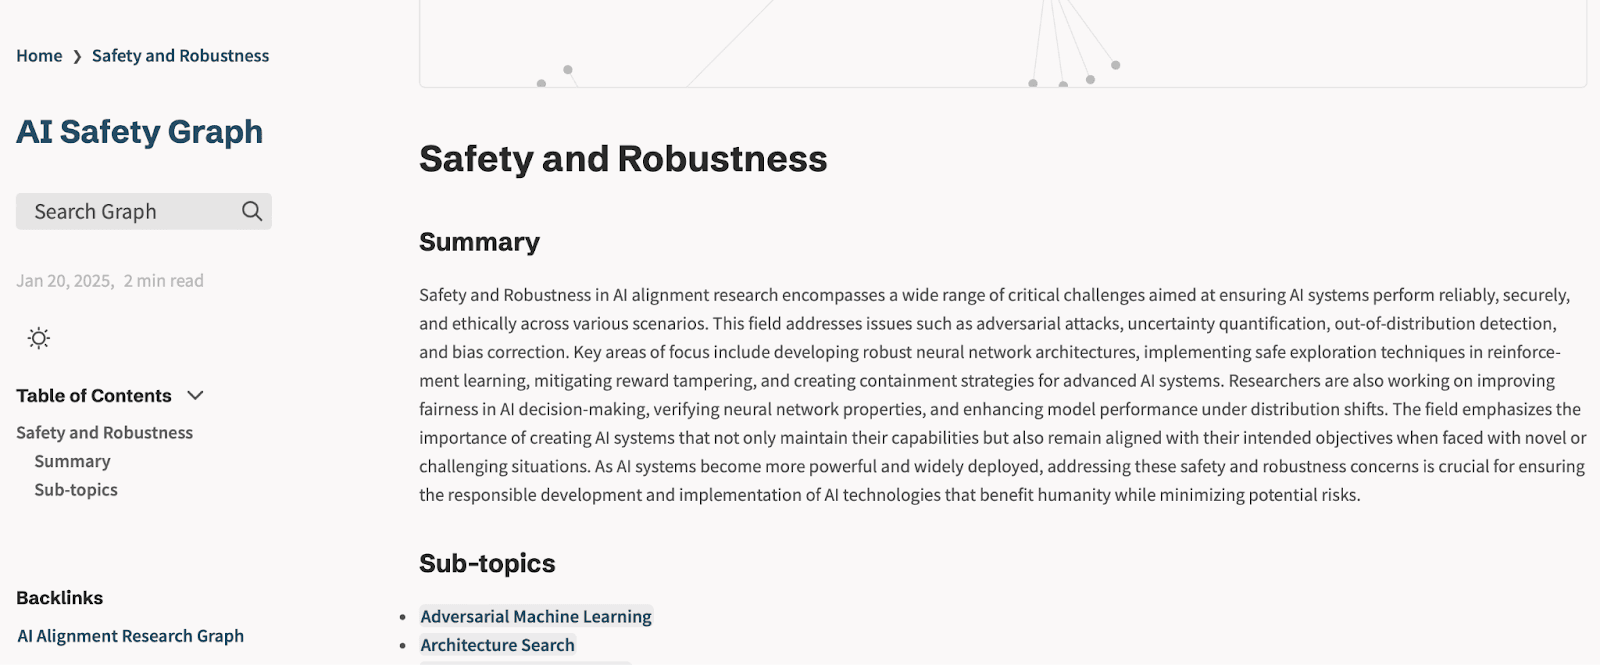
Figure 3: Summary view of ‘Safety and Robustness’ subtopic created during LLM clustering
Beyond Traditional Paper Databases
Traditional paper databases, such as arXiv, excel when you know exactly what you're looking for – but research often requires exploratory learning when the right keywords aren't obvious from the start. Our tool transforms this experience by letting researchers discover connections visually, uncovering relevant research areas they might not have known to search for.
Studies show that visual knowledge graphs aid in learning through concept mapping while fostering personalised learning (Abu-Salih and Alotaibi, 2024). For a new researcher, understanding where to start and how different concepts connect can be overwhelming (Arnold et al., 2023). Our tool addresses these challenges by providing an interactive, visual avenue to the AI alignment research landscape.
Here's how our approach compares to existing tools in Figure 4:
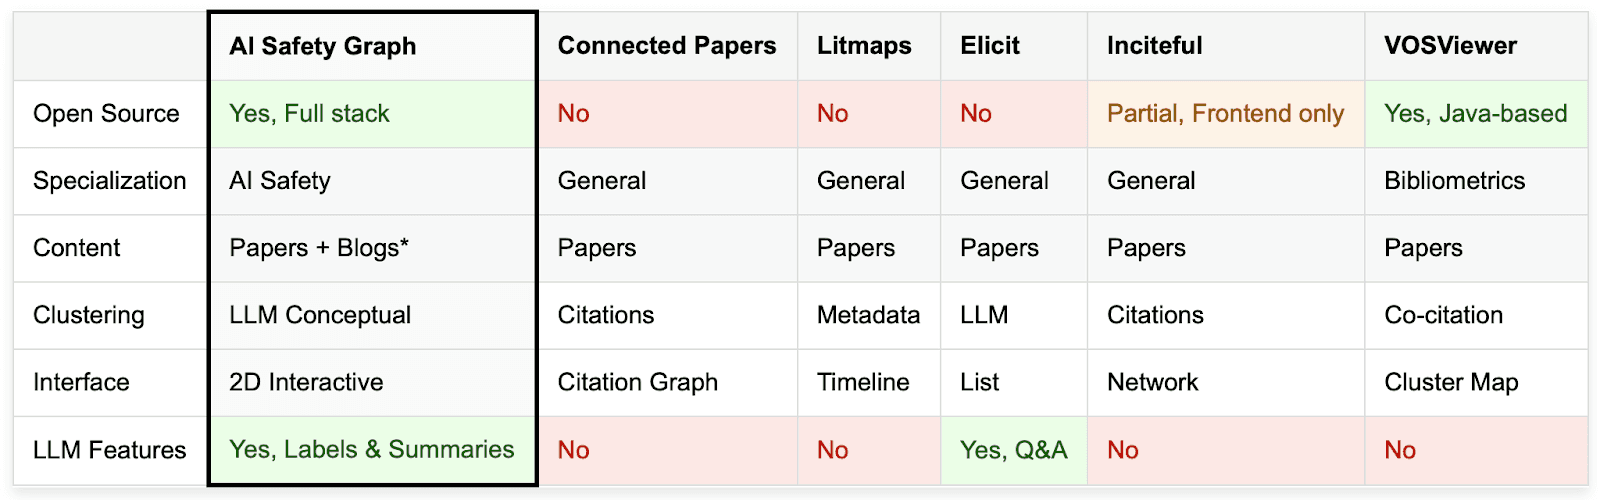
Figure 4: Our tool compared to existing tools. *blog integration underway - helps us visually connect Alignment Forum posts to relevant papers!
Cross-Source Integration: Our empirical analysis [3] suggests that a significant amount of highly relevant AI safety content exists outside peer-reviewed publications. We're actively working to integrate these valuable sources, starting with Alignment Forum posts.
Built for (and by) the Alignment Community: The community’s iterative feedback ensures the tool stays aligned with their evolving research workflows and conceptual framings.
Open-Source Philosophy: We believe tools for exploring open research should themselves be open. While many existing solutions are proprietary, our entire project code is open-source, enabling community contributions and transparency.
The Road Ahead
So far we have identified the following areas for improvement:
Enhanced Visualization - Developing spatial layouts, proven to increase user perception-engagement, that surface emerging research directions and non-obvious connections.
Advanced Clustering - Implementing o1/r1-style refinement cycles for higher-quality taxonomies with improved token efficiency.
Dynamic Content Pipeline - Moving from static datasets to automated updates that keep pace with new research (currently bottlenecked by API costs/refresh mechanisms).
We recognize that our current implementation is just the beginning. To make this tool truly valuable for the alignment community, we need your input and participation. Whether you're a researcher, developer, or alignment enthusiast, we welcome your feedback and contributions to help shape the future of this platform.
Check out our live website and share your thoughts to help shape the project’s future:
Acknowledgements
This project began at a hackathon hosted by Apart Research at LISA. We thank Sruthi Kuriakose, who contributed to the project during the hackathon and during the Lab Studio program, and Samuel Ratnam, who was a member of the original hackathon team. Special thanks to the Apart Lab Studio mentorship team, and to Jason Schreiber, Jacob Haimes, Natalia Pérez-Campanero Antolín and Jacques Thibodeau for their valuable feedback. We're also grateful to Jan H. Kirchner and colleagues for developing the Alignment Dataset that made this work possible.
Footnotes
[1] Obsidian is a personal knowledge base and note-taking application that allows users to make internal links for notes and then visualize the connections as a graph.
[2] Research area is any subtopic of AI safety generated via LLM clustering based on semantic relationships between papers.
[3] The International AI Safety Report 2025 (p. 26) by the UK’s Department for Science, Innovation and Technology and AI Safety Institute, included non-peer-reviewed sources due to the AI field’s rapid development.


